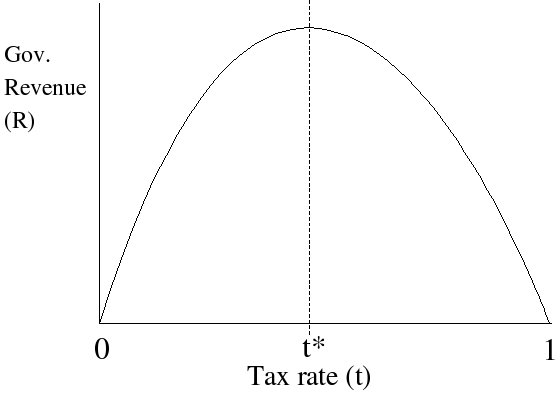
At the extremes were 0% and 100% tax rates and 0 marginal tax revenue, and "somewhere inbetween" lay a maximum, or optimal marginal tax rate that would provide just low enough to motivate the population to remain productive, but just high enough so that the government would reap some of the benefit as well. Some have actually tried to calculate just where this optimal value likes using time series regression analysis, such as this paper by Yu Hsing at Southeastern Louisiana University, USA claiming that the optimal marginal tax rate for income tax is between 32.67% and 35.21%
Today, economists and politicians alike are still struggling with just where that magical "optimal tax rate" lies.


Excel graphs for those who like to squint. The top graph is the overall tax revenues as % of GDP as a 2 year moving average. The bottom graph is real GDP growth rate 5 year moving average.
If anyone knows how to embed excel charts into blogs, please share.
I took data from the US Office of Management and Budget to determine the overall effective tax revenue as % of GDP, and real GDP growth. The real GDP growth was calculated by dividing by the Consumer Price Index for that year. The GDP values are 5 year moving averages.
From Kennedy to the present, each administration has had it's try at manipulating the tax codes to stimulate the economy. From Johnson to Bush senior, a clear trend appeared to take shape - whether or not a Democrat or Republican was in office, whoever decided to raise taxes would see a subsequent drop in real GDP, and consequently whoever lowered taxes saw a rise in real GDP.
Until Clinton . . . from Clinton on, the trend appeared to have reversed?
Clinton continuously raised the overall tax revenues as a % of GDP in an effort to run a surplus and pay down the national debt. The result - a booming economy with continued rise in real GDP.
And then along came Bush, with significant tax cuts early on, but no real gain in real GDP, and when the tax revenue rose as % of GDP no Clintonesque miracle boom, but rather a bust, as the laffe curve would have predicted.
So even though it looks good on the back of a napkin, this "optimal" value appears to be very elusive, and can make any president or congress look like a fool if they play this game the wrong way. Right now Obma is banking on a GDP recovery, and critics are not so optimistic that now is the best time to be paying down the national debt by increasing overall tax receipts just like the Clinton administration did.
How low too low and how high is too high?
Here's a pick of countries with the lowest, and the highest capital gains tax rates from the Howie Institute. Looks like Congo, China, Germany and the US are at the top at ~ 38%
and Singapore, Ghana and Mexico at the bottom, ~ 10% even as low as 6% (Hong Kong).
Apparently there is more to public policy and economic development than the effective or marginal tax rate, and simply adjusting your tax rates to meet your spending and defecit wishlist targets doesn't always result in immediate economic growth.
In a recent CNN article, Jeanne Sahadi takes a critical look at the underlying assumptions behind the recent budget proposal by the administration.
Reality check on Obama's deficit plan
By Jeanne Sahadi, CNNMoney.com senior writerThe administration laid out several key approaches to whittling down U.S. debt. Whether they pan out as the president hopes is a question mark.
...
Raising taxes on high-income filers
The assumptions: Reduce the deficit by $637 billion over 10 years by letting the Bush tax cuts expire in 2011 for singles making more than $200,000 and couples making more than $250,000.
Reality check: Letting the tax cuts expire has a good chance of happening. But the savings that achieves could be undercut if two other revenue raising efforts don't pan out.
...
Obama hopes to raise $318 billion over 10 years with this provision and use it to help pay for his new health reform fund.
Separately, he wants to make permanent his signature credit for low- and middle-income families and fund it by requiring companies to pay for the amount of carbon emissions they produce. He estimates a cap and trade program, which is the subject of much debate, would raise $646 billion.
If either or both of these revenue raisers don't pan out, the administration will have to propose other ways to help pay for his new initiatives or risk further increasing the deficit.
"The key to the budget is whether they stick to that pledge [to pay for their new proposals] because they have the potential to add enormously to the deficit if they're not paid for," said Bob Bixby, director of the Concord Coalition, a deficit watchdog group.

How low is low? Here's a pick of countries with the lowest, and the highest effective tax rates.
ReplyDeletehttp://internationaltrade.suite101.com/article.cfm/highest_taxed_countries
Looks like Congo, China, Germany and the US are at the top at ~ 38%
and Singapore, Ghana and Mexico at the bottom, ~ 10% even as low as 6% (Hong Kong).
Maybe there is more to public policy than the effective tax rate ?