Sunday, March 29, 2009

Winners and Losers - Performance by Industry MARCH 2009

Tire and Jewlrey beat Crops and Medical Supplies.

I give up at trying to predict the market.  

On 09 MAR 2009, the Dow hit a low of 6547, the lowest since December 1996, over 12 years ago. Since then the Dow has seen a recovery for March to as high as 7800.

I was curious to see which industries rebounded the quickest.  
So I pulled the date from Google Finance from 02 - 27 MAR 09.

My gut instinct was that high-end retailers would still feel the brut force of a sluggish economy, while manufacturing and mining would see a boost as investors look for an opportunity to get in early on the recovery in the commodities industries.

At the time, I decided to buy heathcare, gold and silver, with the thought of new attention from the Obama heathcare reform initiative, and fear of inflation from the Feds recent aggressive moves to lower interest rates.

The results. . . 

I'm now more puzzled than ever.  My GLD, OCR, and SLV moves turned out to underperform relative to the S&P 500.  The only moves that I feel like I could have predicted were the boosts in Iron and Steel and Rental and Leasing Services, and the drops in Tobacco and Gambling.  Pretty much everything else seemed like a crapshoot.

Anyone care to interpret?

By Sector

Change Sector

15.27% Basic Materials
14.26% Technology
14.00% Finance
13.74% Conglomerates
12.18% Capital Goods
11.93% Consumer Cyclical
11.74% Transportation

11.00%  S&P 500

9.36% Energy
5.37% Healthcare
5.32% Services
2.12% Utilities
-0.13% Consumer Non-Cyclical

By Industry

Change Industry Sector

41.92% Tires Consumer Cyclical
38.96% Textiles - Non Appare Consumer Cyclical
32.99% Jewelry and Silverware Consumer Cyclical
30.82% Mobil Homes & RVs Capital Goods
28.96% Rental and Leasing Services
27.96% Photography Consumer Cyclical
27.87% Chemicals - Plastics and Rubber Basic Materials
26.71% Furniture and Fixtures Consumer Cyclical
26.21% Construction & Agricultural Machinery Capital Goods
24.21% Retail - Technology Services
22.58% Appliance and Tools Consumer Cyclical
22.01% Insurance (Life) Financial
21.73% Metal Mining Basic Materials
21.10% Retail (Apparel) Services
20.57% Computer Hardware Technology
20.28% Semiconductors Technology
18.78% Iron and Steel Basic Materials
18.37% Apparel and Accessories Consumer Cyclical
17.87% Construction - Services Capital Goods
17.82% Insurance (Miscellaneous) Financial
17.73% Banks - Money Centers Financial
17.69% Air Courier Transportation
16.92% Investment Services Financial
16.37% Trucking Transportation
16.07% Motion Picture Services
16.01% Computer Peripherals Technology
15.89% Electronic Instrument and Controls Technology
15.86% Construction - Supplies and Fixtures Capital Goods
15.57% Retail - Specialty Services
15.09% Retail - Home Improvements Services
14.92% Computer Storage Devices Technology
14.53% Forestry and Wood Products Basic Materials
14.43% Banks - Regional Financial
14.26% Technology [Services] Services
14.18% Auto and Truck Parts Consumer Cyclical
13.74% Conglomerates Conglomerates
13.27% Communications Equipment Technology
12.85% Printing Services Services
12.21% Insurance (Property and Casualty) Financial
12.15% Container and Packaging Basic Materials
12.08% Recreational Activities Services
12.05% Railroads Transportation
11.97% Footwear Consumer Cyclical
11.97% Software and Programming Technology
11.96% Oil and Gas - Operations Energy
11.92% Security Systems and Services Services
11.84% Consumer Financial Services Financial
11.74% Transportation [Services] Services
11.55% Misc Fabricated Products Basic Materials
11.38% Recreational Products Consumer Cyclical
11.28% Fabricated Plastics and Rubber Basic Materials
11.25% Audio and Visual Equipment Consumer Cyclical

11.00% S&P 500

10.82% Computer Networks Technology
10.80% Aerospace and Defense Capital Goods
10.59% Restaurants Services
9.94% Fish and Livestock Consumer Non Cyclical
9.94% Retail - Department and Discount Services
9.82% Misc Capital Goods Capital Goods
9.61% Chemical Manufacturing Basic Materials
9.41% Insurance (Accidental and Health) Financial
9.14% Gold and Silver Basic Materials
8.88% Oil and Gas - Integrated Energy
8.75% Airline Transportation
8.71% Banks - S&L Financial
8.68% Paper and Paper Products Basic Materials
8.58% Office Supplies Consumer Non Cyclical
8.46% Auto and Truck Manufacturers Consumer Cyclical
8.06% Coal Energy
7.91% Oil Well Service and Equipment Energy
7.88% Office Equipment Technology
7.09% Retail - Grocery Services
6.95% Hotels and Motels Services
6.71% Computer Service Technology
6.58% Casino and Gaming Services
6.57% Personal Services Services
6.48% Misc Transportation Transportation
6.46% Waste Management Services Services
6.15% Miscellaneous Financial Services Financial
6.15% Scientific and Technical Instruments Technology
5.95% Biotechnology and Drugs Healthcare
5.65% Major Drugs Healthcare
4.62% Retail - Drugs Services
4.58% Communications Services Services
4.42% Business Services Services
4.41% Medical Equipment and Supplies Healthcare
4.13% Construction - Raw Materials Capital Goods
3.89% Natural Gas Utilities Utilities
3.81% Schools Services
3.62% Non-Metallic Mining Basic Materials
3.37% Water Transportation Transportation
3.27% Water Utilities Utilities
2.87% Advertising Services
2.73% Real Estate Operations Services
2.43% Printing and Publishing Services
2.12% Utilities [Services] Services
2.08% Beverages (Alcoholic) Consumer Non Cyclical
1.84% Personal and Household Products Consumer Non Cyclical
1.70% Food Processing Consumer Non Cyclical
1.67% Electric Utilites Utilities
-0.02% Healthcare Facilities Healthcare
-2.47% Tobacco Consumer Non Cyclical
-3.87% Crops Consumer Non Cyclical
-4.51% Beverages (Non-Alcoholic) Consumer Non Cyclical
-12.31% Broadcasting and Cable TV Services

Sunday, March 8, 2009

'Cramdown' legislation gives courts authority to set mortage terms

bankruptcy judges now have the authority to set loan terms such as principal balance and interest rates

One more challenge to stabilizing the financial sector .

This cannot be a good move, and may explain the markets poor reaction this past week. If the Administration continues down a path of setting prices based on homeowners needs rather than market forces, it seems unlikely that the market confidence in mortgage backed assets will be positive, and only exasperate the housing market lending issues, and work to undermine efforts to stabilize the overall financial crisis.

US House passes mortgage debt plan

Jessica Holzer | March 06, 2009 The Australian Business

A MEASURE to allow strapped US homeowners to reduce the principal balance on mortgage debts in bankruptcy has cleared a key hurdle.

US House passes mortgage debt plan

Picture: Bloomberg

The US House of Representatives has passed the bill.

The measure, if it becomes law, would give borrowers substantially more leverage in their negotiations with creditors.

Proponents, including the Obama administration, believe the change will help spark a turnaround in the housing market by encouraging mortgage servicers to modify more loans voluntarily. The banking industry says it will raise borrowing costs for all homeowners.

The measure passed as part of broader housing legislation on a 234-191 vote, after Democrats agreed to a set of changes pushed by centrists in their ranks to narrow its scope.

The changes also aimed to convince waverers that the measure was a complement to the administration's broader program of incentives for lenders to modify loans.

"This is one component of a very large effort to stabilise the housing market and limit the number of home foreclosures in California and across the country," said Ellen Tauscher, who was the lead negotiator for centrist Democrats on the bill.

A record 5.4 million homeowners were behind on their mortgage payments at the end of last year, the Mortgage Bankers Association reported. Up to 10 million US homeowners are at risk of default over the next one to two years, Moody's Economy.com estimates.

Under the legislation, bankruptcy judges would be able to reduce the principal amount of mortgage loans for struggling borrowers - a process dubbed "cramdown."

Currently, only vacation properties, and not primary residences, can be crammed down by bankruptcy judges.

The banking industry warns the change will raise borrowing costs for all homeowners and clog the bankruptcy courts, prompting judges to write off tonnes of other consumer debt just when lenders are reeling from the financial crisis.

The industry mounted a fierce lobbying campaign that made inroads with several centrist Democrats in recent weeks. A vote on the legislation was delayed last week after several began to balk at the measure.

The Obama administration argues that mortgage cramdowns should be used as a last resort, only when borrowers have run out of other options.

The measure faces a far steeper climb in the Senate, where Republicans, who largely oppose the measure, still hold a lot of sway.

It was attached to broader legislation related to the current crisis that enjoys broader support, including a measure to raise permanently the cap on federal deposit insurance coverage from $US100,000 to $US250,000.

The legislation would also boost the Federal Deposit Insurance Corporation's line of credit with the US Treasury to $US100 billion from $US30 billion.

Under the legislation, mortgage servicers would acquire a safe harbour against lawsuits from investors after they modify loans. The bill would also ease restrictions on the Hope for Homeowners program. Begun last fall to help borrowers refinance into more affordable government-backed mortgages, the program has failed to gain much traction.

The cramdown measure, introduced in the last Congress, gained momentum in recent weeks due to the change in power in Washington and the perception that lenders haven't done enough to modify loans.

Opposition to mortgage cramdown has eroded further after Citigroup agreed to back the measure after politicians offered to limit it to existing mortgages.

A host of consumer groups and borrower advocates, including the AARP, lobbied hard for the measure.

"With rising foreclosures undermining everyone's property values, this new option will not only help hundreds of thousands of homeowners save their homes, it will help keep everyone's property values from sliding further," AARP said in a statement.

U-6 could hit 20% by 2010

The US Department of Labor routinely removes certain types of unemployed people from their "official" unemployment statistic. Some of those who are removed include; those who are either part-time but seeking full time employment, or have been unemployed for an extended period of time and have stopped actively seeking employment. There are also those who for other reasons do not qualify for unemployment insurance (resigned, fired "for cause", etc..). When all of these are included into an "augmented" employment statistic, the picture becomes much more grim.

Broader Unemployment Rate Hits 14.8%

by Sudeep Reddy
The Wall Street Journal March 6, 2009, 10:52 AM ET


If a half-percentage-point increase in unemployment rate isn’t ugly enough for you, there’s more from your government statisticians: almost a full percentage point jump in a broader measure of unemployment.

The Labor Department reported today that its most comprehensive measure of joblessness hit 14.8% in February, from 13.9% in January. That’s just about 1 out of 7 Americans who are either unemployed and looking for a job, want a job but stopped looking, or part-timers who want full-time jobs.

We’ve already blown through the prior high point of the data series, which the Bureau of Labor Statistics started in 1994. An even broader (since discontinued) series hit 15% in late 1982, and we’re likely to fly right through that one next month.

The 8.1% official unemployment rate, up from 7.6% in January, only counts people who are available for work and actively looked for a job in the prior four weeks. The 14.8% figure (known as the “U-6” by the BLS) includes everyone in the 8.1% figure, plus people who say they want a job and looked for work recently, along with people working part-time because they couldn’t get a full-time schedule.

How high can the U-6 go? Just looking at forecasts for the main unemployment rate, the broader measure would hit 17% by the end of next year. Some economists say 18% to 20% — 1 out of 5 people unemployed in some way — wouldn’t be terribly surprising. If employers aren’t hiring, job hunters would be more likely to give up hope and stop looking even if they do want jobs. After the 2001 recession, employers took roughly two years to resume meaningful hiring and competition was stiff for the jobs available. Anyone searching for a job during this recession is already aware of that grim reality.

Tuesday, March 3, 2009

The Laffer Peak - Can the US take any more taxes?

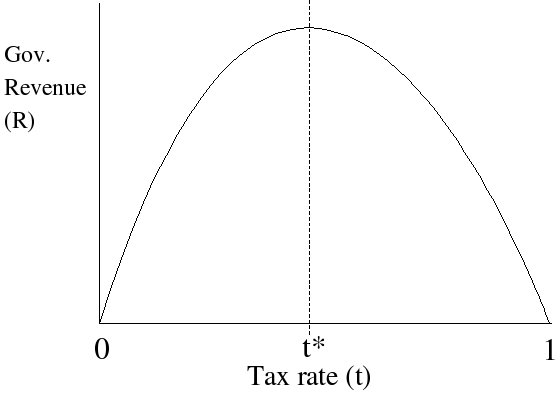
In 1974, an economist Arthur Laffer described supply-side economics and the relationship between marginal tax rates, and marginal tax revenues as a parabolic curve on the back of a napkin to Dick Cheney, Donald Rumsfeld, and Jude Wanniski.


At the extremes were 0% and 100% tax rates and 0 marginal tax revenue, and "somewhere inbetween" lay a maximum, or optimal marginal tax rate that would provide just low enough to motivate the population to remain productive, but just high enough so that the government would reap some of the benefit as well. Some have actually tried to calculate just where this optimal value likes using time series regression analysis, such as this paper by Yu Hsing at Southeastern Louisiana University, USA claiming that the optimal marginal tax rate for income tax is between 32.67% and 35.21%

Today, economists and politicians alike are still struggling with just where that magical "optimal tax rate" lies.


Excel graphs for those who like to squint. The top graph is the overall tax revenues as % of GDP as a 2 year moving average. The bottom graph is real GDP growth rate 5 year moving average.

If anyone knows how to embed excel charts into blogs, please share.
I took data from the US Office of Management and Budget to determine the overall effective tax revenue as % of GDP, and real GDP growth. The real GDP growth was calculated by dividing by the Consumer Price Index for that year. The GDP values are 5 year moving averages.

From Kennedy to the present, each administration has had it's try at manipulating the tax codes to stimulate the economy. From Johnson to Bush senior, a clear trend appeared to take shape - whether or not a Democrat or Republican was in office, whoever decided to raise taxes would see a subsequent drop in real GDP, and consequently whoever lowered taxes saw a rise in real GDP.

Until Clinton . . . from Clinton on, the trend appeared to have reversed?

Clinton continuously raised the overall tax revenues as a % of GDP in an effort to run a surplus and pay down the national debt. The result - a booming economy with continued rise in real GDP.

And then along came Bush, with significant tax cuts early on, but no real gain in real GDP, and when the tax revenue rose as % of GDP no Clintonesque miracle boom, but rather a bust, as the laffe curve would have predicted.

So even though it looks good on the back of a napkin, this "optimal" value appears to be very elusive, and can make any president or congress look like a fool if they play this game the wrong way. Right now Obma is banking on a GDP recovery, and critics are not so optimistic that now is the best time to be paying down the national debt by increasing overall tax receipts just like the Clinton administration did.

How low too low and how high is too high?

Here's a pick of countries with the lowest, and the highest capital gains tax rates from the Howie Institute. Looks like Congo, China, Germany and the US are at the top at ~ 38%
and Singapore, Ghana and Mexico at the bottom, ~ 10% even as low as 6% (Hong Kong).

Apparently there is more to public policy and economic development than the effective or marginal tax rate, and simply adjusting your tax rates to meet your spending and defecit wishlist targets doesn't always result in immediate economic growth.

In a recent CNN article, Jeanne Sahadi takes a critical look at the underlying assumptions behind the recent budget proposal by the administration.

Reality check on Obama's deficit plan

By Jeanne Sahadi, CNNMoney.com senior writer
The administration laid out several key approaches to whittling down U.S. debt. Whether they pan out as the president hopes is a question mark.


...

Raising taxes on high-income filers

The assumptions: Reduce the deficit by $637 billion over 10 years by letting the Bush tax cuts expire in 2011 for singles making more than $200,000 and couples making more than $250,000.

Reality check: Letting the tax cuts expire has a good chance of happening. But the savings that achieves could be undercut if two other revenue raising efforts don't pan out.

...

Obama hopes to raise $318 billion over 10 years with this provision and use it to help pay for his new health reform fund.

Separately, he wants to make permanent his signature credit for low- and middle-income families and fund it by requiring companies to pay for the amount of carbon emissions they produce. He estimates a cap and trade program, which is the subject of much debate, would raise $646 billion.

If either or both of these revenue raisers don't pan out, the administration will have to propose other ways to help pay for his new initiatives or risk further increasing the deficit.

"The key to the budget is whether they stick to that pledge [to pay for their new proposals] because they have the potential to add enormously to the deficit if they're not paid for," said Bob Bixby, director of the Concord Coalition, a deficit watchdog group.

Sunday, March 1, 2009

The end of suburbia and single-family homes


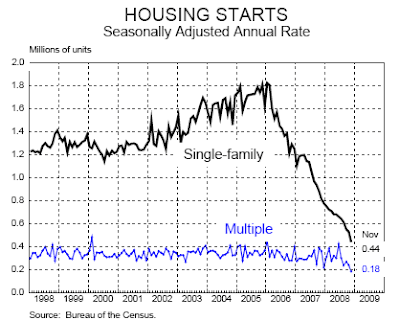
I found this chart on a website about economic forecasts for 2009 .

It looks as though slowly but surely, the real estate developers are responding to the market forces against low density housing.

In the chart, single family units have been on the decline since 2005, whereas multiple family units has been steady.

This chart supports the prediction that the ultimate consequence of rising energy and transportation costs is a contraction of housing development towards higher density, multiple family units.

This is a good sign for transportation reform, since low density suburbs have been one of the biggest deterrents to political support for improving public transit systems.

Here's how it may play out

Developers stop building new single-family homes, but continue with multi-family units
The lack of new homes, tightening credit, and rising gas prices will raise the cost of suburb living
The rising cost of suburban living will force residents into the more affordable high density areas
The rise in urban residents will result in increased ridership on public transit
The increased ridership will force more routes and decrease time waiting for the next bus/train
The improved service will result in higher ridership, and more movement to the urban centers
This feedback cycle will plummet the real estate value of the old suburbia
The now cheap real estate outside the urban center will attract manufacturing to fill in the void

Net Result

safer, more affordable, transportation
less dependency on oil imports
more manufacturing jobs