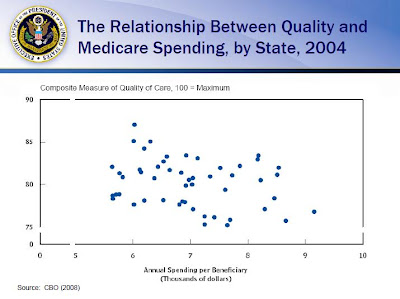
If a picture is worth a thousand words, then in this case I would say a good chart is worth a million. The chart compares Medicare spending per beneficiary, and quality index for each state in 2004.
The results ?
Priceless.
This chart is a wonderful demonstration of the most fundamentally important inference one can make in any scientific study.
I gained a new appreciation for Peter Orszag, Obama Administration's Treasury Secretary, when I saw this slide in a presentation he gave on education and healthcare to the Association of American Universities this morning (21 APR). The presentation does not come with audio, unfortunately, although he touched on the main points of his presentation in Orszag's blog entry on healthcare reform, posted shortly after the delivery of his speech. His points were right on target on the issue of aggregate educational achievement in the US, an issue that has long been neglected in the talk about US productivity slowdown since the 90's.
Many of you have heard me go on about how important it is to reform health care in order to bend the curve on long-term costs and get our nation on firmer fiscal footing [...] When we say that health care is consuming too much of our GDP, we are not just citing an abstract statistic [...]
One might think that health care costs were unrelated to educational trends, but that would be wrong. For years now, there has been a long-running trend toward declining State investments in public universities, as growing health care costs come to crowd out States’ investment in higher education. For example, from the late 1970s to the early part of this decade, State appropriations for higher education have declined from about $8.50 out of every $1,000 in personal income to only a little more than $7 out of every $1,000 in personal income – a decline of roughly 15 percent [...] At the same time, these pressures yield tuition hikes, program cuts, and a general strain on our public universities [...]
The fewer college grads we produce, the slower overall economic growth and the higher the salaries for those fortunate enough to go to college. And since we know that those from lower-income families are less likely to go to college and graduate [...], the overall result is that we perpetuate inequality.Bingo
Some may see this as another excuse for the Administration to push their partisain spending agendas on education and healthcare, which may be a very valid interpretation of the situation.
Keep in mind, however, that the problem of educational achievement in the US is a problem recognized across party lines, and made especially clear in the report issued by the America’s National Academy of Engineering : Rising above the Gathering Storm. Since the report was issued in 2006, it has had a tremendous bipartisain impact on attitudes about innovation and competitive advantages in the global economy.
Although Peter may have done this out of his own initiative to push the Administration's agenda, it's also possible that he was simply responding to a letter from the AAU, asking him to address the issue.

The X-axis in this case is 2004 Medicare spending per beneficiary (span: 0 - 10,000 USD), and the Y-axis is composite measure of quality care for that same year (span : 0 - 100).
Each data point represents a different US state.

No comments:
Post a Comment